Hi,
I’m running CoreElec on KIII Pro and I would like to keep an eye on hardware temperatures through my iPhone. Is there any addon and app which would display CoreElec/Kodi system and hardware information in iOS app. Ideally with widget too. Basically something like iStat view is on mac. Thanks for any suggestions.
1 Like
Install ssh client (e.g. putty), connect to box via ssh and submit command: watch cputemp.
2 Likes
That is working great. Thank you
But it would be even better if there was a widget for this or even app which would connect automatically and maybe showed a bit more info about HW
I didn’t try it myself, so I don’t know, if this even works for non-router devices, or what information exactly is being displayed.
But maybe you could install “NetData System Monitor” using Entware:
https://hqt.ro/netdata-system-monitor/
2 Likes
That’s great! 
That looks sleek as hell. I love it, going to install it on my dev box
2 Likes
2 question, how exactly did you install it to CoreElec?
And is there CPU temperature somewhere too?
Take a look at this thread on how to install Entware on CE:
The instructions for installing the system monitor with Entware can be found on the website I posted earlier.
According to a Google search it is possible to display sensor data/temperatures, too.
1 Like
It seems temperature reading isn’t supported. There is a solution for the RPI and sensors is included with the virtual.system-tools addon, but sensors outputs this:
No sensors found!
Make sure you loaded all the kernel drivers you need.
Try sensors-detect to find out which these are.
Sensors-detect isn’t included with the addon and this is the sensors help:
Usage: sensors [OPTION]… [CHIP]…
-c, --config-file Specify a config file
-h, --help Display this help text
-s, --set Execute `set’ statements (root only)
-f, --fahrenheit Show temperatures in degrees fahrenheit
-A, --no-adapter Do not show adapter for each chip
–bus-list Generate bus statements for sensors.conf
-u Raw output
-j Json output
-v, --version Display the program versionUse
-' after-c’ to read the config file from stdin.
If no chips are specified, all chip info will be printed.
Example chip names:
lm78-i2c-0-2d -i2c-0-2d
lm78-i2c-0- -i2c-0-
lm78-i2c--2d -i2c--2d
lm78-i2c--* -i2c--*
lm78-isa-0290 -isa-0290
lm78-isa- -isa-
lm78-*
Any chip name we can try for Amlogic?
Could you try “aml_thermal-virtual-0” as the chip name, please?
Temperature is also not displayed in millidegrees, which is the typical format lm-sensors is expecting, but in degrees instead.
Therefore you should add the following config to your sensors3.conf:
chip "*-virtual-0"
    label temp1 "CPU"
compute temp1 @*1000 , @/1000Specified sensor(s) not found!
Anyway, I don’t think sensors is needed at all. Check this thread
This bash module method looks promising.
Unfortunately I’m not at home currently and can’t test anything.
CoreELEC:/ # find . -name "sensors3.conf"
CoreELEC:/ #
How can I add those lines into non-existing file?
You don’t need this.
Apparently there is no sensors module in the kernel, which we could use.
I also had no luck using the bash method. The “sensors” entry is just not showing up in the navigation.
Although there is an /opt/var/log/netdata/ path, no logs are available.
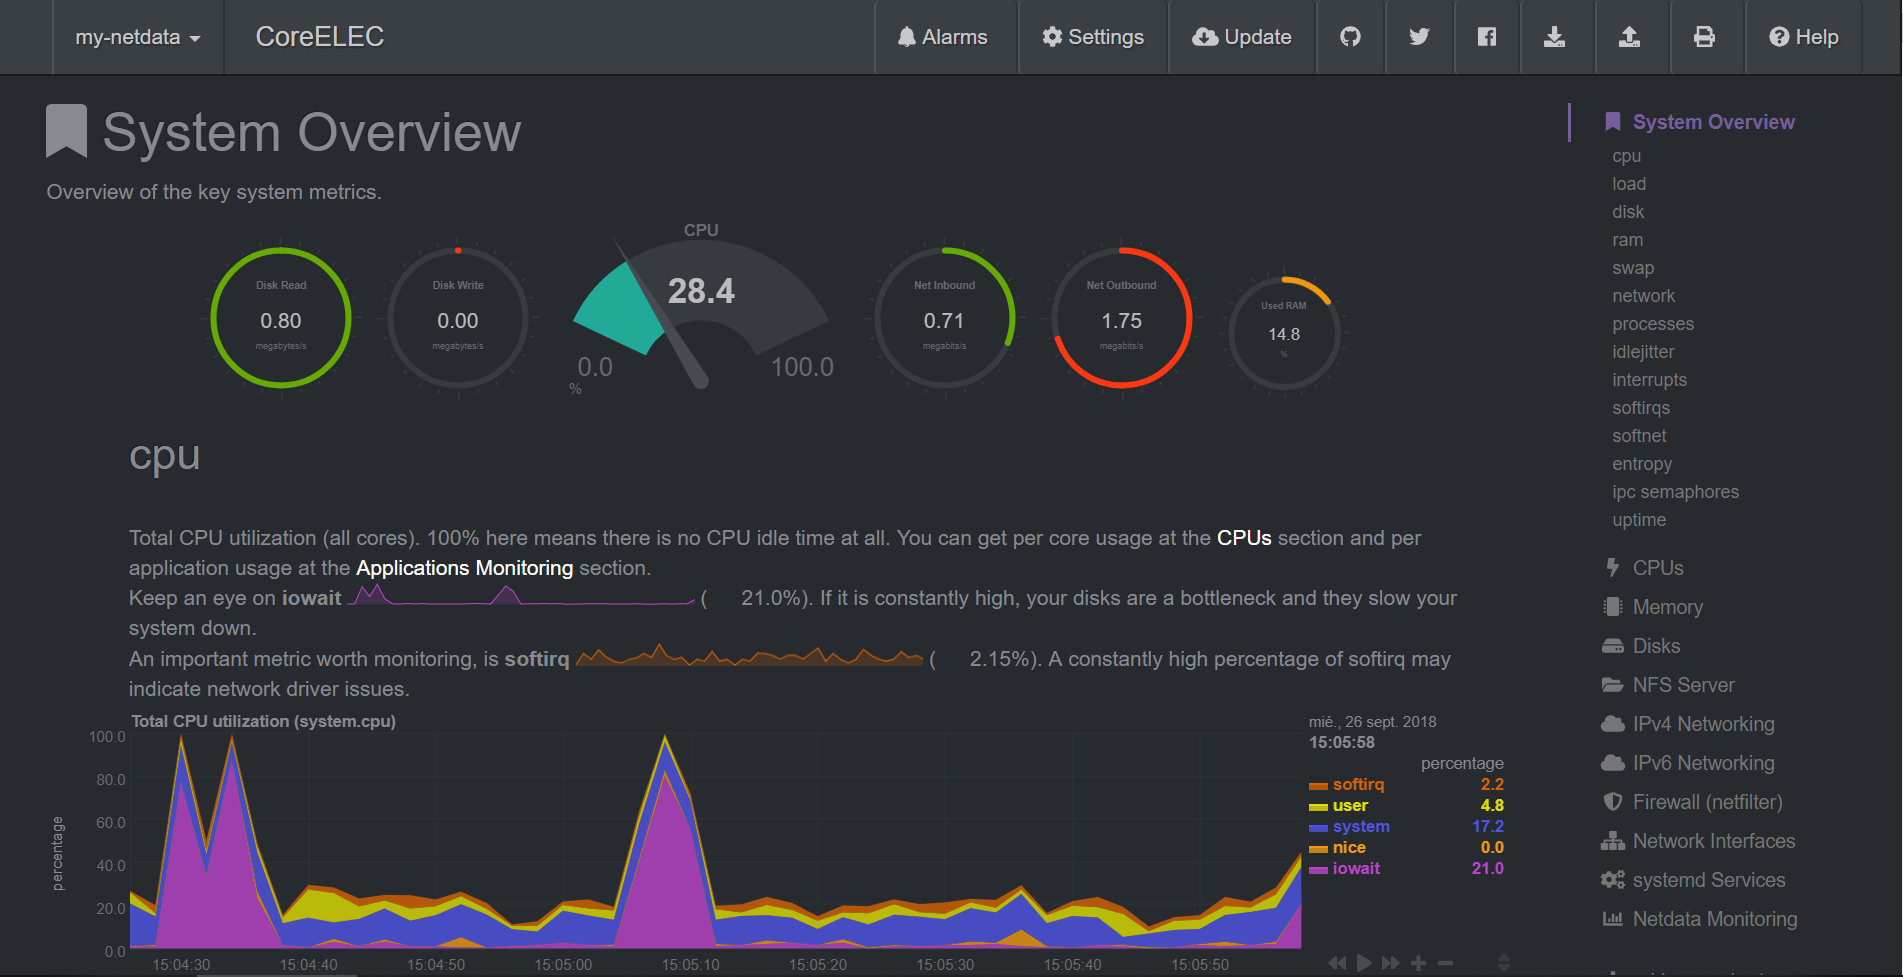
But…holy graph madness…there is a sh*tload of information included in this thing.
The one we need is missing: Temperature
Edit /opt/etc/netdata/netdata.conf:
debug log = /opt/var/log/netdata/debug.log
error log = /opt/var/log/netdata/error.log
access log = /opt/var/log/netdata/access.log
So, I managed to install Netdata and it’s working fine. But the temperature is really the main function I need, to keep an eye on the KIII PRO cpu temp. I also found unofficial app for iOS, called NetData, but when I add in the server address, it says Invalid server - weird.
Anyway, lets focus on temp display first.
BTW, NetData is amazing. I really like the design and the amount of data. It shows both of the external hard drives connected to USBs. Really cool
The bash method using charts.d modules won’t work, because it apparently needs a full blown version of bash instead of the busybox we are using in CE.
What I found out so far:
The charts.d module needs to be enabled to be used for sensors.
This can be done in /opt/etc/netdata/netdata.conf
charts.d = yes
According to the article previously posted by Uukrul, sensors should be disabled in /opt/etc/netdata/python.d.conf to prevent using the lm-sensors method:
sensors = no
…and enabled in /opt/etc/netdata/charts.d.conf, to use the bash method instead:
sensors = force
But after a restart of the netdata service, it’s still not included in the navigation.
If you are executing the charts.d.plugin script manually with debug option enabled, you are getting an error message:
# /opt/lib/netdata/plugins.d/charts.d.plugin debug 1
bash: 0: unknown operand
/opt/lib/netdata/plugins.d/charts.d.plugin: line 97: syntax error: bad substitution
This is a problem in the function “require_cmd()”, which only checks for available bash commands.
Even if you comment out this function, the corresponding command checks and another line a bit below, which parses the output of this function (because this isn’t required for the execution of the script itself), it fails with another error in a charts.d plugin file.
I think, we would really need to rewrite the whole charts.d.plugin script as well as all modules started with it. This is a bit too much work for a simple temperature graph.
It would be easier for sure to write a python.d plugin, which checks /sys/devices/virtual/thermal/thermal_zone0/temp, but that’s out of my comfort zone.