2018-09-26 23:22:04: netdata INFO : PLUGINSD[charts.d] : Initializing file /opt/var/cache/netdata/sensors.temp_thermal_zone0_thermal_thermal_zone0/main.db.
2018-09-26 23:22:04: netdata INFO : PLUGINSD[charts.d] : Initializing file /opt/var/cache/netdata/sensors.temp_thermal_zone0_thermal_thermal_zone0/sys_devices_virtual_thermal_thermal_zone0_temp.db.
/opt/lib/netdata/plugins.d/charts.d.plugin: Cannot use current_time_ms_from_uptime() - new time 510 is older than the last 82256790 - falling back to current_time_ms_from_date().
/opt/lib/netdata/plugins.d/loopsleepms.sh.inc: line 22: 1537996924 * 1000 + %-N / 1000000 : syntax error: operand expected (error token is "%-N / 1000000 ")
2018-09-26 23:22:04: netdata ERROR : PLUGINSD[charts.d] : read failed
2018-09-26 23:22:04: netdata ERROR : PLUGINSD[charts.d] : ‘/opt/lib/netdata/plugins.d/charts.d.plugin’ (pid 22207) disconnected after 0 successful data collections (ENDs).
2018-09-26 23:22:04: netdata ERROR : PLUGINSD[charts.d] : ‘/opt/lib/netdata/plugins.d/charts.d.plugin’ (pid 22207) does not generate useful output but it reports success (exits with 0). Waiting a bit before starting it again…
I didn’t know, a bash installation was available in Entware.
That’s great…kind of…at least one step closer.
The main problem now seems to be this one (again executed charts.d.plugin with debug enabled):
2018-09-26 23:43:10: charts.d: INFO: main: started from '/opt/lib/netdata/plugins.d/charts.d.plugin' with options: debug 1
/opt/lib/netdata/plugins.d/loopsleepms.sh.inc: line 22: 1537998190 * 1000 + %-N / 1000000 : syntax error: operand expected (error token is "%-N / 1000000 ")
/opt/lib/netdata/plugins.d/loopsleepms.sh.inc: line 63: [: : integer expression expected
2018-09-26 23:43:10: charts.d: INFO: main: configuration file '/opt/lib/netdata/plugins.d/../../../../etc/netdata/charts.d.conf' not found. Using defaults.
This version of bash seems to have problems with calculations using $(( … )).
Furthermore it can’t find the file /opt/etc/netdata/charts.d.conf, though the path should be the right one.
EDIT: No, wait…the path to the charts.d.conf isn’t the right one, because it searches the file in /etc/netdata/ instead of /opt/etc/netdata.
At least, if I count the “…/” correctly, because my eyes begin to flicker, now. ^^
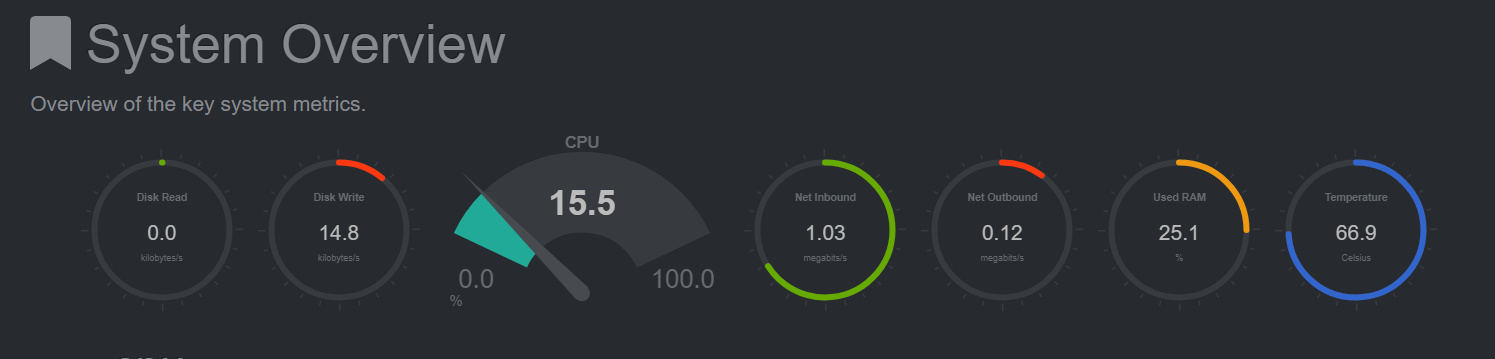
If you only want to do a quick hack moving around gauges, edit /storage/.opt/share/netdata/web/index.html (function headMain(os, charts, duration) at pos 1656)
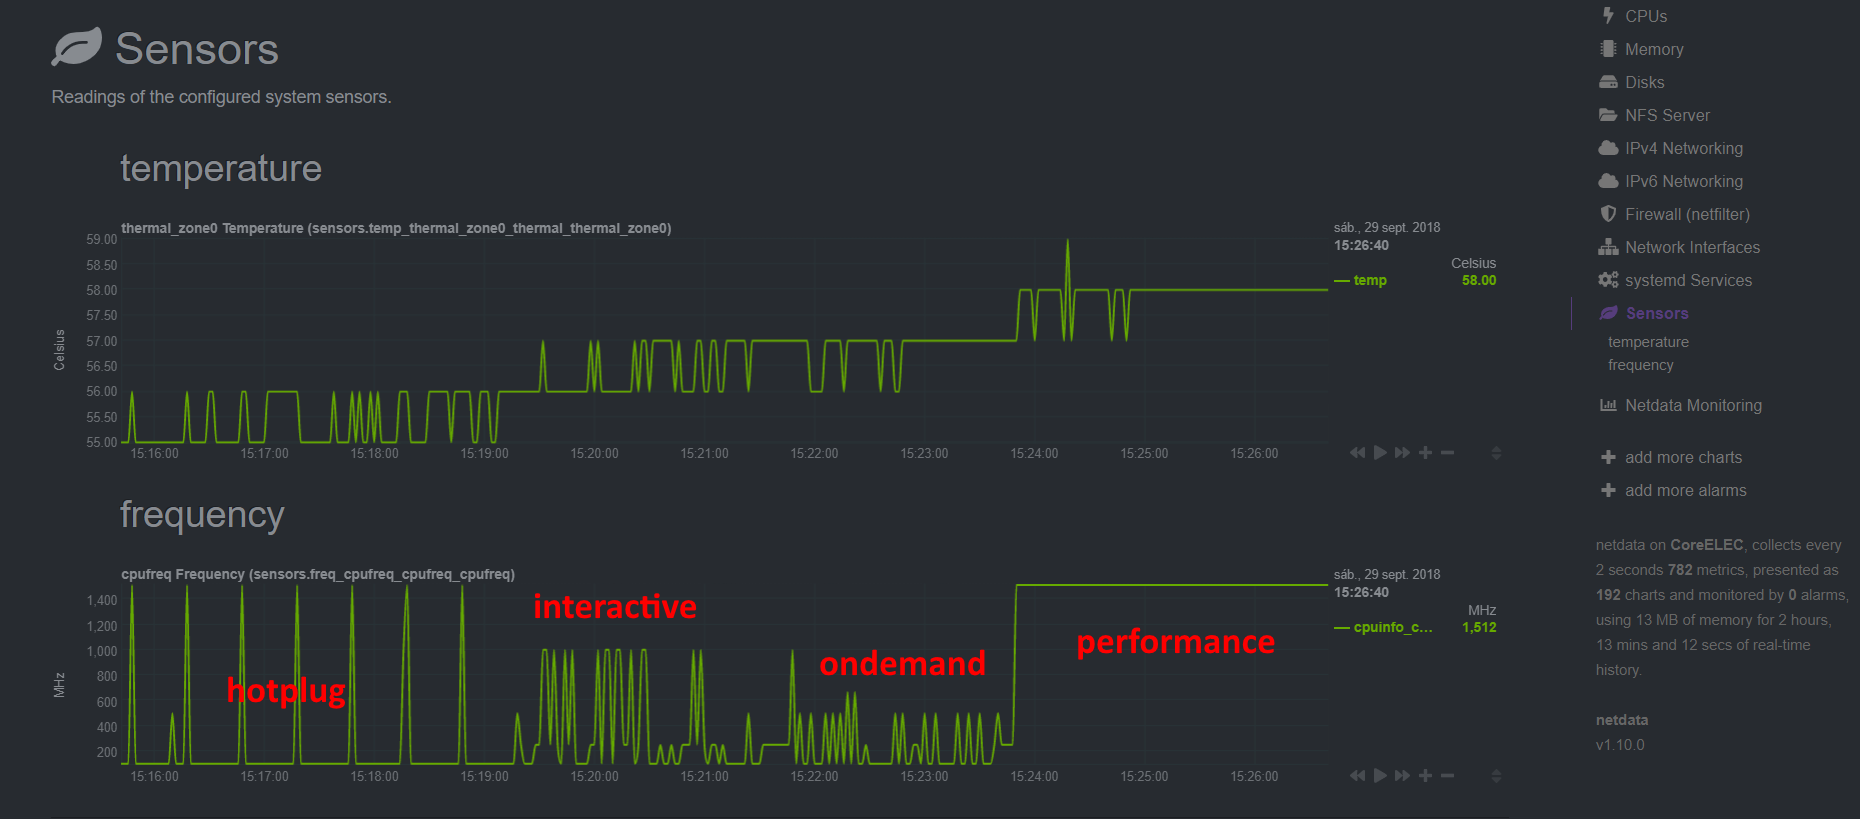
Damn, I should have checked that before writing one for the sensors section. At least I prefer it near the temperatures graph so it isn’t time wasted. Here is one image with a comparison for the different governors: