S922X Ugoos AM6B Device Tree - Performance/Efficiency - Testing Needed

DDR is double data rate no? So it’s base clock x2.

taskset (available with entware) can be used to pin lmbench to any one or group of cores. With lmbench there’s a noticeable latency shift going from L1 to L2 to RAM. With that again it doesn’t make any difference if the L2 cache dtb nodes are present. L1 caching is done by one core, unified L2 caching is used for large reads. Pinning lmbench to all cores, the caching is performed by the A73 cores, which can both be seen in the latency difference between the two clusters and the CPU usage.

I’m not sure what sort of benchmarking would be required to show that there is or isn’t a difference with the dtb cache changes?

I am not sure either, we aren’t increasing the max performance. We are increasing the min performance. I don’t know if there is any benchmark that takes min performance at low CPU loads. In other words raising the floor vs raising the ceiling.

I am seeing posts on 905X4 saying the youtube add-on is faster with these changes. 905X4 doesn’t have big.little and yet they are seeing improvements so we can rule out the dmips-mhz settings. Maybe you can look at that underlying code of that youtube addon to understand what its doing and how is that addon benefitting.

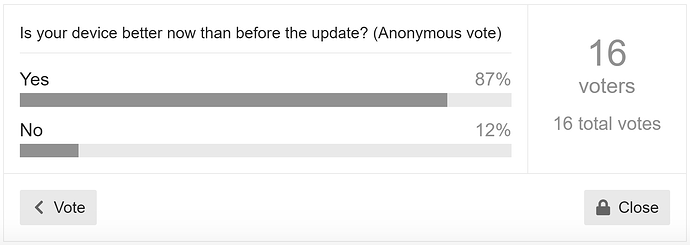
I think it is sufficient to say many people do notice a difference and I am ready to take a step back from any benchmarking to just enjoy the ugoos in its new state.

1 Like

There’s also people saying they can’t tell any difference. I’m hesitant to draw conclusions off a 10-20% change based on perception. People are still reporting faster boot times, even though that’s measurable and no different.

You do not have to draw any conclusions. You do not even have to use the new dtb. The instructions originally showed how to backup the old one, you can always restore it as to how it was before the update.

For me my android box instantly turns on from sleep and ugoos takes forever.

The majority of people will report tap water tastes better if you tell them it’s from the Himalayas :smile:

4 Likes

It is space for improvement of gpu performance ? In android we have support of vulkan, but is not in CE. Profit is for retroarch (e.g. flycast kernel) where is measurable of performance differences in fps. Talking about mali security issue is possible here: psirt@arm.com ( Arm’s Product Security Incident Response Team - PSIRT)

Also would be use and then fix some vulnerabilities of gpu memory:

And if is not too much work, so will be but at least nice have last kernel of 4.9 root kernel as : 4.9.337 from january 2023. Hardkernel realised for N2 for example 4.9.337 and also kernel 6.6. in ubuntu 24.04 Ubuntu 24.04 for ODROID-N2/N2Plus/M1/M1S - ODROID. Here are all kernels from HK with also 4.9.337: Tags · hardkernel/linux · GitHub

CE is not using mainline kernel 4.9. Which means patch version doesn’t matter.
4.9.269 will be the only one.

It is not reason for using only 4.9.269, when drivers and firmwares must works in all 4.9.y.

For mainline kernel our advice is to use Libreelec.

So after sleeping on it I could come up with some thoughts.

  1. We are trying to measure the Linux Kernel’s behavior.
  2. We want to find the cache hit/miss ratio before and after by reading the stats
  3. We do not have a way of reading this by default in core elec

I researched a bit and found

  • references to using perf for some statistics.
  • Stack overflow posts saying that the very act of making a measurement by polling repeatedly puts load on the Linux scheduler and that load makes it behave differently. (We can use performance governor to avoid CPU freq scaling)

If you can help compile perf library for ARM then we can find some data.

Application note for DMIPS benchmark: Documentation – Arm Developer

If you can help compile this too then we can get the other data.

I tried and got a segmentation fault error in my binary

2 Likes

Dhrystone may not be the best way to measure application processor performance. Especially when the cache configuration is to be evaluated.

1 Like

Oprofile seems to be available on Entware.
Then you can use to profile the CPU before and after. About OProfile

1 Like

@YadaYada

I found a 12 year old github repo that compiles: GitHub - qris/dhrystone-deb: Debian package for the Dhrystone benchmark in C

Dhrystone Results

taskset -c 0,4 ./dhry

Dhrystone Benchmark, Version 2.1 (Language: C)

Program compiled without ‘register’ attribute

Please give the number of runs through the benchmark: 100000000

Execution starts, 100000000 runs through Dhrystone
Execution ends

Final values of the variables used in the benchmark:

Int_Glob: 5
should be: 5
Bool_Glob: 1
should be: 1
Ch_1_Glob: A
should be: A
Ch_2_Glob: B
should be: B
Arr_1_Glob[8]: 7
should be: 7
Arr_2_Glob[8][7]: 100000010
should be: Number_Of_Runs + 10
Ptr_Glob->
Ptr_Comp: 19165584
should be: (implementation-dependent)
Discr: 0
should be: 0
Enum_Comp: 2
should be: 2
Int_Comp: 17
should be: 17
Str_Comp: DHRYSTONE PROGRAM, SOME STRING
should be: DHRYSTONE PROGRAM, SOME STRING
Next_Ptr_Glob->
Ptr_Comp: 19165584
should be: (implementation-dependent), same as above
Discr: 0
should be: 0
Enum_Comp: 1
should be: 1
Int_Comp: 18
should be: 18
Str_Comp: DHRYSTONE PROGRAM, SOME STRING
should be: DHRYSTONE PROGRAM, SOME STRING
Int_1_Loc: 5
should be: 5
Int_2_Loc: 13
should be: 13
Int_3_Loc: 7
should be: 7
Enum_Loc: 1
should be: 1
Str_1_Loc: DHRYSTONE PROGRAM, 1’ST STRING
should be: DHRYSTONE PROGRAM, 1’ST STRING
Str_2_Loc: DHRYSTONE PROGRAM, 2’ND STRING
should be: DHRYSTONE PROGRAM, 2’ND STRING

Microseconds for one run through Dhrystone: 0.1
Dhrystones per Second: 16611296.0

taskset -c 0,1 ./dhry

Dhrystone Benchmark, Version 2.1 (Language: C)

Program compiled without ‘register’ attribute

Please give the number of runs through the benchmark: 100000000

Execution starts, 100000000 runs through Dhrystone
Execution ends

Final values of the variables used in the benchmark:

Int_Glob: 5
should be: 5
Bool_Glob: 1
should be: 1
Ch_1_Glob: A
should be: A
Ch_2_Glob: B
should be: B
Arr_1_Glob[8]: 7
should be: 7
Arr_2_Glob[8][7]: 100000010
should be: Number_Of_Runs + 10
Ptr_Glob->
Ptr_Comp: 27959696
should be: (implementation-dependent)
Discr: 0
should be: 0
Enum_Comp: 2
should be: 2
Int_Comp: 17
should be: 17
Str_Comp: DHRYSTONE PROGRAM, SOME STRING
should be: DHRYSTONE PROGRAM, SOME STRING
Next_Ptr_Glob->
Ptr_Comp: 27959696
should be: (implementation-dependent), same as above
Discr: 0
should be: 0
Enum_Comp: 1
should be: 1
Int_Comp: 18
should be: 18
Str_Comp: DHRYSTONE PROGRAM, SOME STRING
should be: DHRYSTONE PROGRAM, SOME STRING
Int_1_Loc: 5
should be: 5
Int_2_Loc: 13
should be: 13
Int_3_Loc: 7
should be: 7
Enum_Loc: 1
should be: 1
Str_1_Loc: DHRYSTONE PROGRAM, 1’ST STRING
should be: DHRYSTONE PROGRAM, 1’ST STRING
Str_2_Loc: DHRYSTONE PROGRAM, 2’ND STRING
should be: DHRYSTONE PROGRAM, 2’ND STRING

Microseconds for one run through Dhrystone: 0.1
Dhrystones per Second: 8210180.5

Column 1 Column 2 Column 3 Column 4 E F G
12-year old bench Energy Back Calc Other DTB
A53 A73 A53 A73 A53 A73
Raw Number 8210180.5 16611296 772 1192 592 1024
Ratio 33% 67% 39% 61% 37% 63%

That solves one mystery. Now we can decide what numbers to actually choose. If you want the binary file to run on your own device I can share it with you.

Now, how correct do we want to be? Should we change it by creating a PR? Or should we let it be because we were both within 2% of each other.

No idea how to solve the other mystery of benchmarking the kernel scheduler. My main concern is that if we don’t use processor perf registers we are inducing load onto the kernel scheduler which alters our observations. Basically how do we find a non-invasive way of measurement?

1 Like

This capacity-dmips-mhz parameter is optional and only helpful if there are differences in core performance, like big/little. In case of single-cluster AML SOCs, all cores have same performance, therefore would make no difference.

Considering calculation rules from kernel documentation:
Beelink said: A73: 4.8 DMIPS/Mhz A53: 2.3 DMIPS/Mhz
DMIPS/MHz ratio normalized to 1024 (value may be varied):

capacity-dmips-mhz A53 core = (2.3 / 4.8) * 1024 = 491
capacity-dmips-mhz A73 core = (4.8 / 4.8) * 1024  = 1024

I checked different sources for DMIPS/MHz, as ARM does not provide any. Source1 Source2 Source3 Esp. values for A73 vary between 4.8 and 8.5 :game_die: , so which one to use?

Maybe you need to do our own measurement.
For Dhrystone benchmark, there is one for AML in mainline Kernel, maybe works on our kernel, too: Link

But the overall question remains: As this parameter is optional, is there any observable benefit for scheduler / load balancing within CE, worth to spend this effort?

2 Likes

Can you post the binary as attachment here? It would be nice to have available for testing in general. All 3 estimates are in the same ballpark. I’m assuming this won’t change much across boards (AM6+, N2+, GT King etc), but I’d be curious to see.

I’m also not sure about benchmarking the cache changes. Since this information is now included in the mainline Linux DTB’s I don’t see a problem including the cache and capacity in CE, regardless of whether’s an effect or not.

I’m leaning towards NOT worth the effort. If given 8 hours of admin time, it is probably better spent on bringing up new S928X SoC than to chase our tails on this.

dhry (9.4 KB)

chmod 755

1 Like

These are the steps I took to take measurements. Downloaded dhry, and installed taskset through entware.

CoreELEC:~/downloads # installentware
CoreELEC:~/downloads # opkg install taskset

To measure the A53 and A73 clusters (1000000000 runs)

Stop Kodi
CoreELEC:~/downloads # systemctl stop kodi

Test A53 core
CoreELEC:~/downloads # taskset -c 0 ./dhry

Test A73 core
CoreELEC:~/downloads # taskset -c 2 ./dhry

s922z (2nd gen Cube)
A53 calculation
8689607.0 dhrystones per second / 1757 (fixed scaling factor) = 4945.7 DMIPS per core

A73 calculation
16655563.0 dhrystones per second / 1757 (fixed scaling factor) = 9479.5 DMIPS per core

Total DMIPS 4945.7 x 2 A53 cores + 9479.5 x 4 A73 cores = 47809.6 DMIPS

A53 calculation
4945.7 DMIPS / 1900Mhz (max core frequency) = 2.603/4.309 * 1024 (normalized to the big core) = 619 capacity-dmips-mhz

A73 calculation
9479.5 DMIPS /2200Mhz (max core frequency) = 4.309/4.309 * 1024 (normalized to the big core) = 1024 capacity-dmips-mhz


s922xj (AM6+)
A53 calculation
8210180.5 dhrystones per second / 1757 (fixed scaling factor) = 4672.8 DMIPS

A73 calculation
16611296 dhrystones per second / 1757 (fixed scaling factor) = 9454.4 DMIPS

Total DMIPS = 4672.8 x 2 A53 cores + 9454.4 x 4 A73 cores = 47163.2 DMIPS

A53 calculation
4672.8/1800 = 2.596/4.297 * 1024 = 619 capacity-dmips-mhz

A73 calculation
9454.4/2200 = 4.297/4.297 * 1024 = 1024 capacity-dmips-mhz


Mainline Linux DTB values
A53 - 592 capacity-dmips-mhz
A73 - 1024 capacity-dmips-mhz

The A53/A73 capacity-dmips-mhz results are remarkably consistent between Cube and AM6+. Maybe that’s not surprising since both are rev b SOCs. It would be nice to get the same calculations from an AM6 (non-plus) or GT King, which are rev a, and the N2+ (rev c).

The benchmark derived values aren’t far off from the mainline Linux values either.
1 Like

According to kernel doc, values have to be measured per single core (w/ cache on).
A53 should have ~2,3DMips/MHz, your results (on two cores) are ~4,6 (8689607 / 1900) :thinking:
Could you redo the tests on single core?

1 Like